


As a myParish app user, you already know how valuable the content can be to your faith community. However, if you spend a little bit of time getting to understand the analytics part of the app, you’ll be able to communicate even more efficiently with your parishioners.
It’s tempting, when looking at analytics, to focus only on how many users we want to reach. While we do want to evangelize as many people as possible, being familiar with the analytics will allow you to do so much more. Simply having a lot of people download the app doesn’t mean you are communicating well with all of them. Taking time to look at the analytics will help you, as the app manager, do the best job possible in reaching out to your faith community.
Below is some general analytics information to get you started. Being familiar with this information will help you manage the app more effectively.
We’ll be sending more app and analytics information in the future. However, if you have questions, you can always reach out to us at 1-800-997-8805. We love to help people!
NOTE: When viewing any of the following analytics, remember to adjust the Start and End dates to your desired date range. The Start date must be AFTER August 20th, 2015.
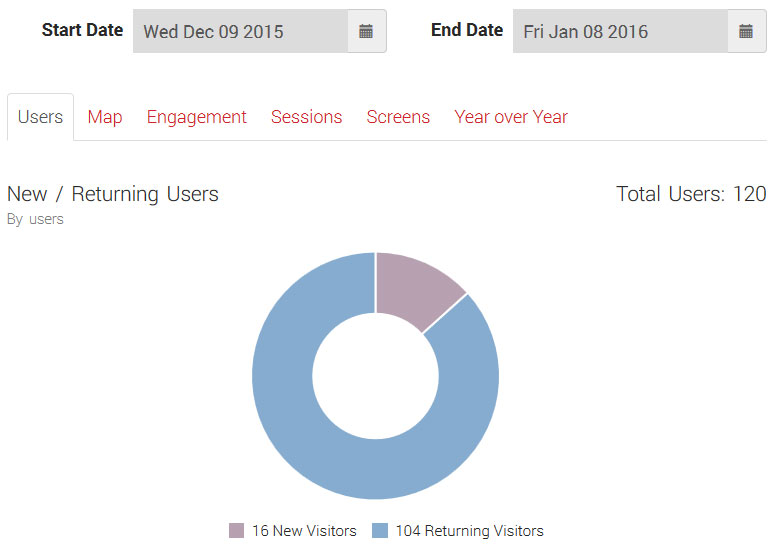
Users
A high percentage of Returning Visitors and a consistent number of New Visitors is ideal for your parish’s app.
NOTE: Numbers will only be reported accurately back to August 20, 2015 when these analytics were implemented.
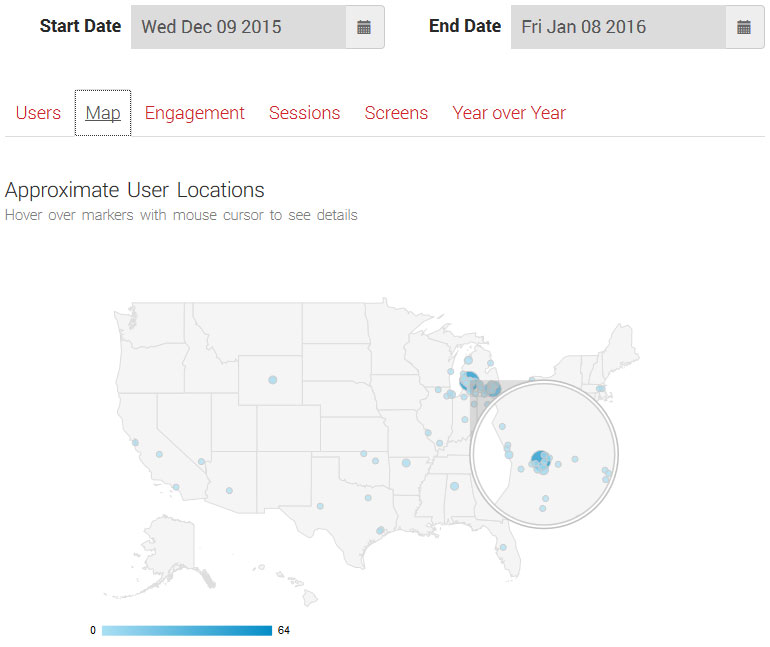
Map
The US map is meant to give you a rough idea of the geographic distribution of your app’s users. You may hover clusters or dark circles with your cursor to zoom.
NOTE: Some small inaccuracies may appear here due to Google Analytics not always correlating city names with the correct state.
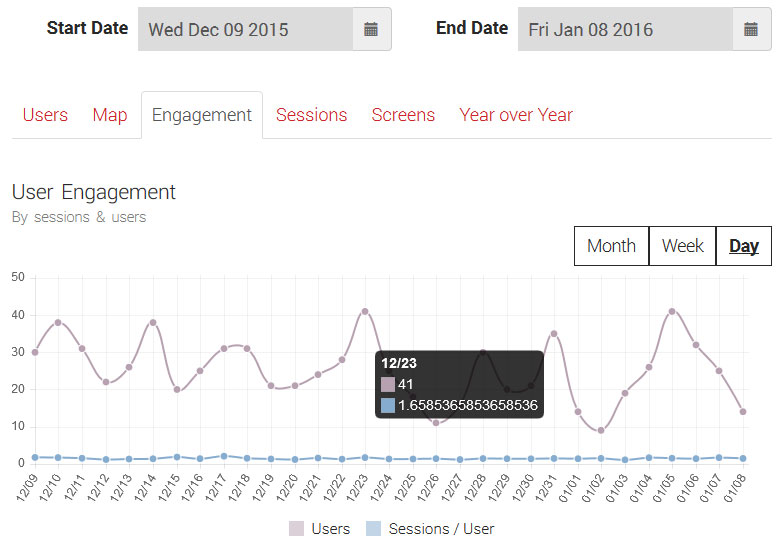
Engagement
This tab shows the number of app users for your parish’s app by day, week, or month, as well as the average number of sessions (times using the app) for each user on each of those occasion (day, week, month).
NOTE: A time period of 2 months or more is best viewed in Month or Week mode.
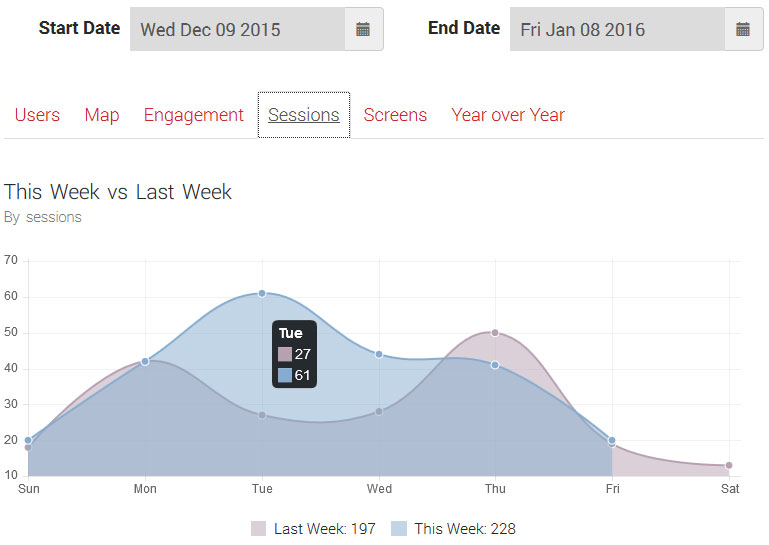
Sessions
This tab will show you the total number of times people used your app each day this week versus last week. You can see if usage of your parish’s app is consistent week to week or if spikes appear because of special events or increased engagement such as messages sent with push notifications.
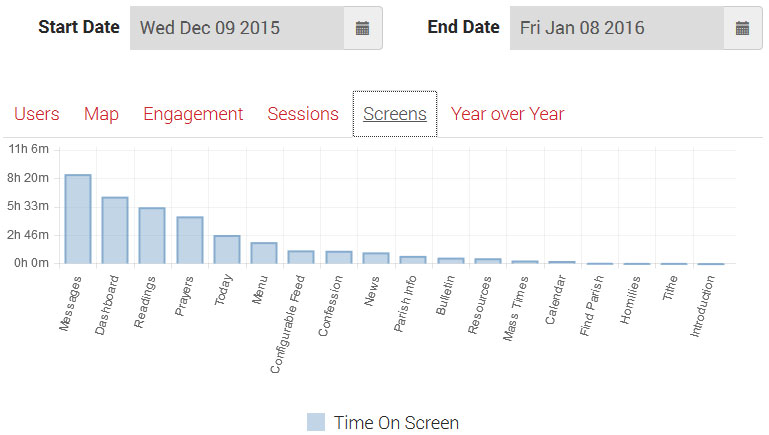
Screens
Here you can see the amount of time users spent on different features of your parish’s app over a period of time.
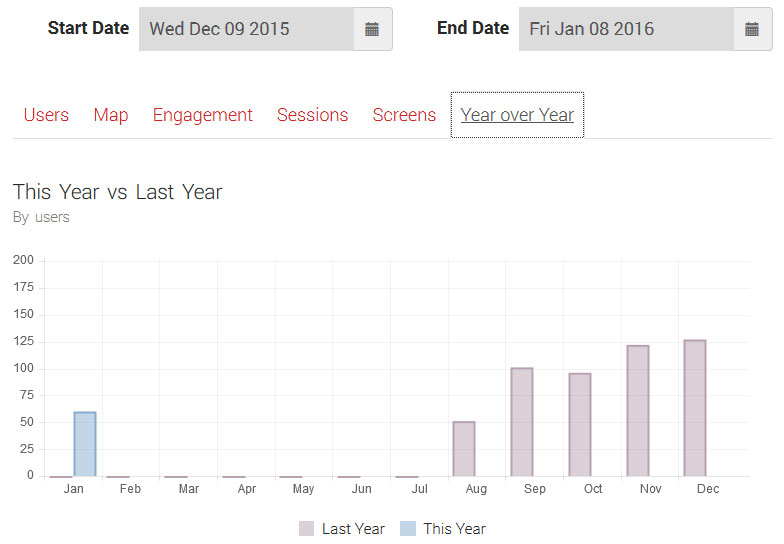
Year over Year
This tab shows how the number of parishioners actively using your app varies month to month. After your parish has used the app for one whole year (post Aug. 20, 2015) these stats may be helpful in identifying seasonal usage trends and variation year to year.
As you dive into numbers, percentages, and averages for your parish’s app, remember to keep an eye out for potential areas of improvement in communication and evangelization with your parishioners and visitors. And remember to contact us at 1-800-997-8805 if you have specific questions.